Hi A. D. X fans, and welcome to another technical analysis video.
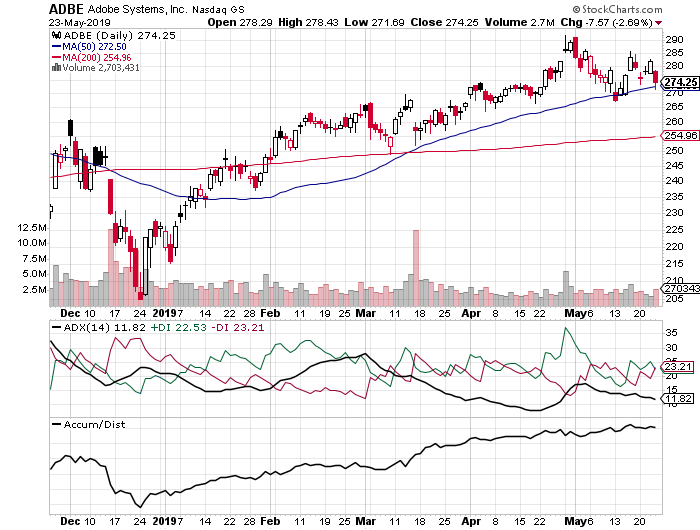
Today we're looking at A D B E, adobe on a daily chart
We can see that the stock is bullish from the 50 day moving average that is sitting above the 200 day moving average.
We can also see that the Accumulation Distribution line is rising, telling us that buyers are still in control.
The A. D. X. indicator whoever is siting at 11 which tell us that the current situation is neutral.
Also the spread difference between the Plus line and the Minus line is very narrow confirming that there is no trade opportunity at this time